The General page of the Properties dialog has the following options:
Object position: it's possible the height of a band can change when it's printed. For example, the detail band may only appear as one line high in the Advanced Report Designer, but if a field's Stretch with overflow setting is turned on (see Field Object Properties), that field may take more than one line if it contains a lot of information, and therefore so does the detail band. The object position settings allow you to specify what happens to objects when the band they're in changes height. The choices are:
Float: specifies that the selected object moves vertically relative to the size of objects directly above it.
Fix relative to top of band: as the band changes height, this object maintains its position relative to the top of the band.
Fix relative to bottom of band: as the band changes height, this object maintains its position relative to the bottom of the band.
Stretch downwards: this option, which isn't available for lines, specifies how the shape is stretched. The choices are:
No stretch: specifies that the object doesn't stretch vertically as the band stretches.
Stretch relative to tallest object in group: specifies that the object stretches to accommodate the tallest object in the group.
Stretch relative to height of band: specifies that the object stretches to fit in the band.
Size and position in layout: rather than trying to precisely size or position an object using the mouse or arrow keys, you can specify the dimensions and location of the object using these controls.
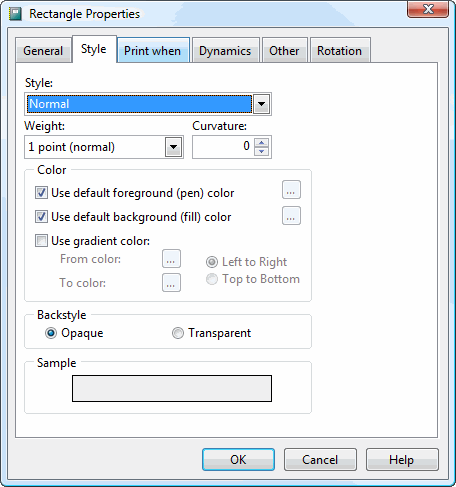
The Style page has the following options:
Style: specifies the type of border to use for the shape: a solid line, a dashed one, and so forth.
Weight: this setting specifies the thickness of the border. Hairline is the thinnest possible border supported by the selected printer. Other choices are 1, 2, 4, and 6 points (where a point is 1/12th of an inch).
Curvature: this setting, which is only available for rounded rectangles, specifies the curvature of the corners of the rectangle. The range of values is 0, which gives a rectangle with square corners, to 99, which gives a circle or ellipse.
Use default foreground (pen) color: turn this setting on to use black for the border color. If you turn this setting off, the button beside it is enabled so you can select the color to use.
Use default background (fill) color: turn this setting, which isn't available for lines, on to use a white fill color for the shape. If you turn this setting off, the button beside it is enabled so you can select the color to use.
Use gradient color: a gradient changes from one color to another. To use a gradient color for the rectangle, turn this setting on and click the buttons beside From color and To color to specify the starting and ending color for the gradient. You can also indicate whether the gradient changes color from left to right or top to bottom. Note the gradient doesn't appear in the Advanced Report Designer (the rectangle appears as a solid "from" color), but only when the report is run.
Here's an example of a rectangle with a gradient color from red to yellow, top to bottom:
Backstyle: this setting determines whether objects behind this one can be seen (the transparent setting) or are covered by this object (the opaque setting). This setting isn't available for lines.
Sample: shows an example of what the shape looks like based on the settings you've selected.
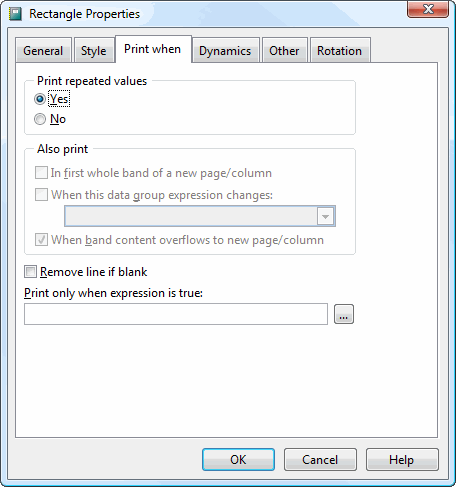
The Print When page allows you to conditionally print an object so it can be ignored under some conditions. It has the following options:
Print repeated values: setting this to No means the object won't print unless one or both of the In first whole band of a new page/column and When band content overflows to new page/column settings are turned on.
In first whole band of a new page/column: prints the object in the first band of a new page or column that isn't an overflow from a previous page or column. This option is automatically turned on (and disabled) if you choose Yes for Print repeated values, and optional if you choose No for Print repeated values.
When this data group expression changes: prints the object when the value of the chosen group changes. This option is available only if a group exists and Print repeated values is No. Choose a group from the list beside this option.
When band content overflows to new page/column: prints the object when the band overflows to a new page or column. This option is available only if Print repeated values is No.
Remove line if blank: removes the entire line of the report the object is on if the object is blank and no other object is on the same line.
Print only when expression is true: an expression to be evaluated before the object prints. If the expression is true, the object is printed; otherwise, it isn't printed. All other options in this dialog except Remove line if blank are disabled if you include an expression. Click the Expression Builder button to display the Expression Builder.
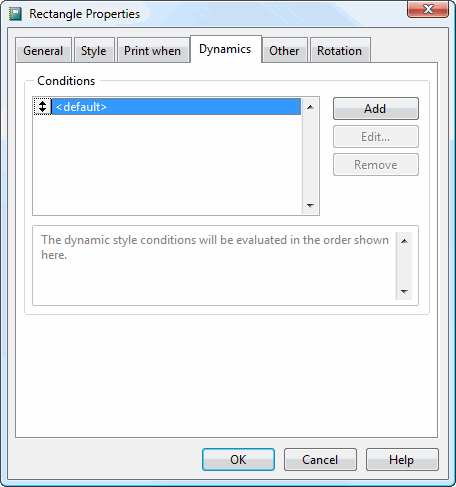
The Dynamics page allows you to change the way the object appears in the report depending on certain conditions. For example, the following report shows a simple bar chart of sales values. Each bar is proportionally sized based on the sales amount:
Note that using dynamic settings significantly increases report generation time, so use it only when required.
The Conditions list shows the conditions you've defined. To add a new condition, click the Add button. Enter the name of the condition and click OK. The following dialog appears.
This dialog has the following options:
Condition Name: the name you assigned to the condition.
Apply when this condition is true: the condition that affects the field. You can enter the expression for the condition or click the button with the ellipsis (...) to display the Expression Builder. For example, entering "TotalPrice < 0" means this condition is used whenever the total price is negative.
Width Expression: enter a value or click the button to display the Expression Builder to specify a width to use when the condition is true. The width must be specified in inches or centimeters, depending on how your system is configured. The default of -1 means use the width already defined for the object.
Height Expression: enter a value or click the button to display the Expression Builder to specify a height to use when the condition is true. The height must be specified in inches or centimeters, depending on how your system is configured. The default of -1 means use the height already defined for the object.
Click the Edit button to display the same dialog shown above to edit the condition settings or Remove to remove the condition. You can also change the order in which conditions are applied by clicking the button in front of the condition name in the list and dragging up or down.
The sample report shown above was created by drawing a red rectangle and creating a dynamic condition with Apply when this condition is true set to .T. (in other words, always apply) and Width Expression set to SalesAmount * 2/3 (the 2/3 ensures the bar isn't too wide given the range of values for the report).
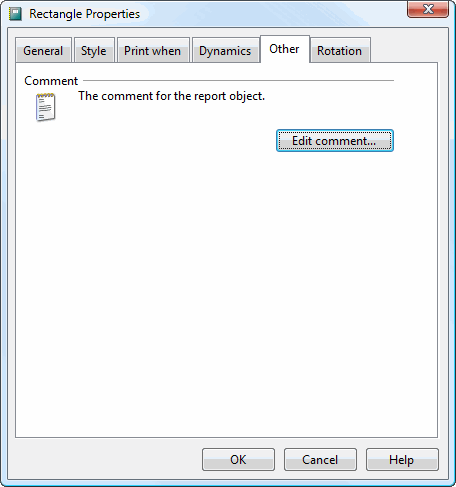
The Other page displays a comment about the object. To change the comment, click the Edit comment button.
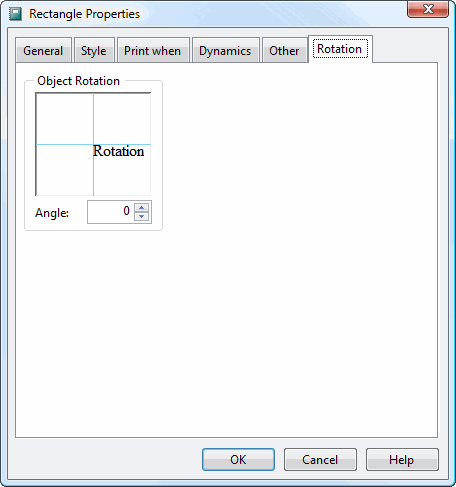
The Rotation page allows you to rotate an object on the report by specifying the rotation angle as a clockwise value (for example, an angle of 90 rotates the object 90 degrees clockwise). A representation of the rotation is shown so you can tell whether you have the desired angle. Note the object doesn't appear rotated in the Advanced Report Designer, but only when the report is run. Also note that using rotation significantly increases report generation time, so use it only when required.
© Stonefield Software Inc., 2025 • Updated: 06/07/16
Comment or report problem with topic
 Rectangle and Line Object Properties