Stonefield Query Enterprise Web
Watch video Schedule Demo View documentation
Stonefield Query Enterprise Web from Stonefield Software Inc. is a self-service, ad hoc, query and reporting solution that enables you to create and deliver business reports quickly and efficiently. Stonefield Query works with virtually any database, including Oracle, Microsoft SQL Server, IBM DB2, MySQL, Pervasive SQL, and many more. It even works with other types of data sources, such as Microsoft Excel spreadsheets, text files, web services, and anything with an API for data access.

Reports When You Need Them
Business users are frustrated by the time it takes for reports to be created by other people or departments. Stonefield Query gives them the ability to create their own reports when they are needed, anytime, anywhere.
Stonefield Query removes the reporting roadblock or "IT Bottleneck" when organizations customize a reporting application specifically for their data sources. All the technical information that's typically needed to create a report is built in and stored in a data dictionary. Therefore, business users can focus on getting the answers they need without needing to learn how to program a report or having to go back to IT for help.
Features
Stonefield Query has the following features:
No Database Experience NecessaryNo need to understand database structures, joins, the SQL language... Stonefield Query has you covered with its built-in knowledge of your database. Descriptive names are used for all fields and tables rather than cryptic database names. Descriptive operators such as "equals" and "greater than" appear instead of "=" and "<." |
Reporting Made SimpleStonefield Query walks you through the reporting process in 5 easy-to-follow steps so you can build professional reports in minutes, not days. |
Fine-Tune Your ReportsYou can customize how each field appears, including column heading, grouping, sorting, and totaling. The easy-to-use filter dialog allows you to include or exclude specific records. Use the sort page to order the information as you need it. |
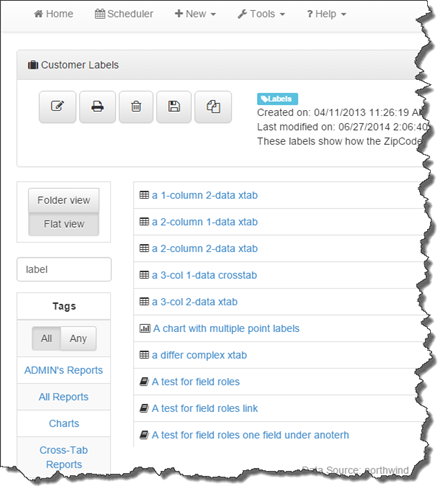
Creating Any Type of LabelYou can easily create labels, including mailing labels, product labels, or barcode labels, without worrying about field positioning or label dimensions. All common label sizes are built-in. |
Output Your WayPreview or print reports, or output to PDF, Microsoft Excel, or just about any file format you can think of with just a few mouse clicks. You can also email reports. |
Handles Code FieldsDisplays the expected value for many code fields rather than the actual values stored in the database so you don't have to figure out what those coded values mean. |
Drill Down ReportsYou can drill down from a report to see details. Drill down supports an unlimited number of levels. |
Template SupportTemplates give your reports a common appearance, such as following corporate style guidelines. |
Schedule and Automatically Deliver ReportsAutomatically deliver reports via e-mail, file, or printer. Schedule them to run anytime you need them to, and never miss a reporting commitment to your peers, customers, or vendors. |
Charts, Graphs, and DashboardsCreate bar, line, area, and pie charts as well as series charts. Dashboards combine multiple charts into one consolidated view of your data. Zoom in and out on the dashboard, update individual reports manually, and output the dashboard to file. |
Built-in Tenant SupportUsers can only see data that belongs to their organization even if the records are all in one database. They can also only access reports, tags, and formulas created for their organization. |
Create Your Own Custom FormulasDefine your own custom calculations to use in any report. Use any of the hundreds of built-in functions or create your own. |
Filters and ExclusionsFilters allow you to narrow down your results without programming, such as product sales by customer for this year, month, or week. Exclusions allow you to report on things not recorded in the database, such as all companies that bought something last year but not this year. |
Multiple Database SupportYou can run reports on more than one database. You can even consolidate records from multiple databases into one report. For example, you could show all outstanding invoices from all companies on the same report, including showing which company each one came from. |
Built-In SecurityControl which users can access which fields and tables, which reports, and what functions they can use. |
Powerful Reports at Your FingertipsDon't be fooled by our ease-of-use. The Advanced Report Designer allows you to lay out the report exactly as you want, including company logos, lines, boxes, etc. |
Stonefield Query Enterprise Pricing
Stonefield Query pricing is based on concurrent users. The Stonefield Query Studio license enables a developer to create the customized reporting application their end users use to create reports from their own database. Report Designer licenses enable users to create, edit, and delete reports. Report Viewer licenses enable users to view existing reports as well as schedule and output reports.
| Stonefield Query Enterprise Studio Includes one Report Designer license | $2,750 |
| Report Designer | $660 |
| Report Designer 50-user license | $11,000 ($220/user) |
| Report Viewer | $440 |
| Report Viewer 50-user license | $5,500 ($110/user) |
| Unlimited Report Viewer license | $15,000 |
Contact us for volume discounts.
Please note:
All prices are in U.S. dollars.
Software maintenance is 25% per year and is required with the initial purchase.
System Requirements
- Windows Vista SP2, Windows 7 SP1, Windows 8, Windows 8.1, Windows Server 2008 R2 SP1, Windows Server 2008 SP2, Windows Server 2012 R2, Windows Server 2016
- Web host: Microsoft Internet Information Server (IIS), 512 MB minimum memory (more is better), 50 MB free hard disk space
- Client: Microsoft Internet Explorer 10 or later, or a recent version of Chrome or Firefox
